Introduction
This page is a brief introduction to understanding the high level concepts necessary to use Nion Swift.
For an introductory tutorial, see Nion Swift Introductory Tutorial.
For installation instructions, Nion Swift Installation.
User Interface
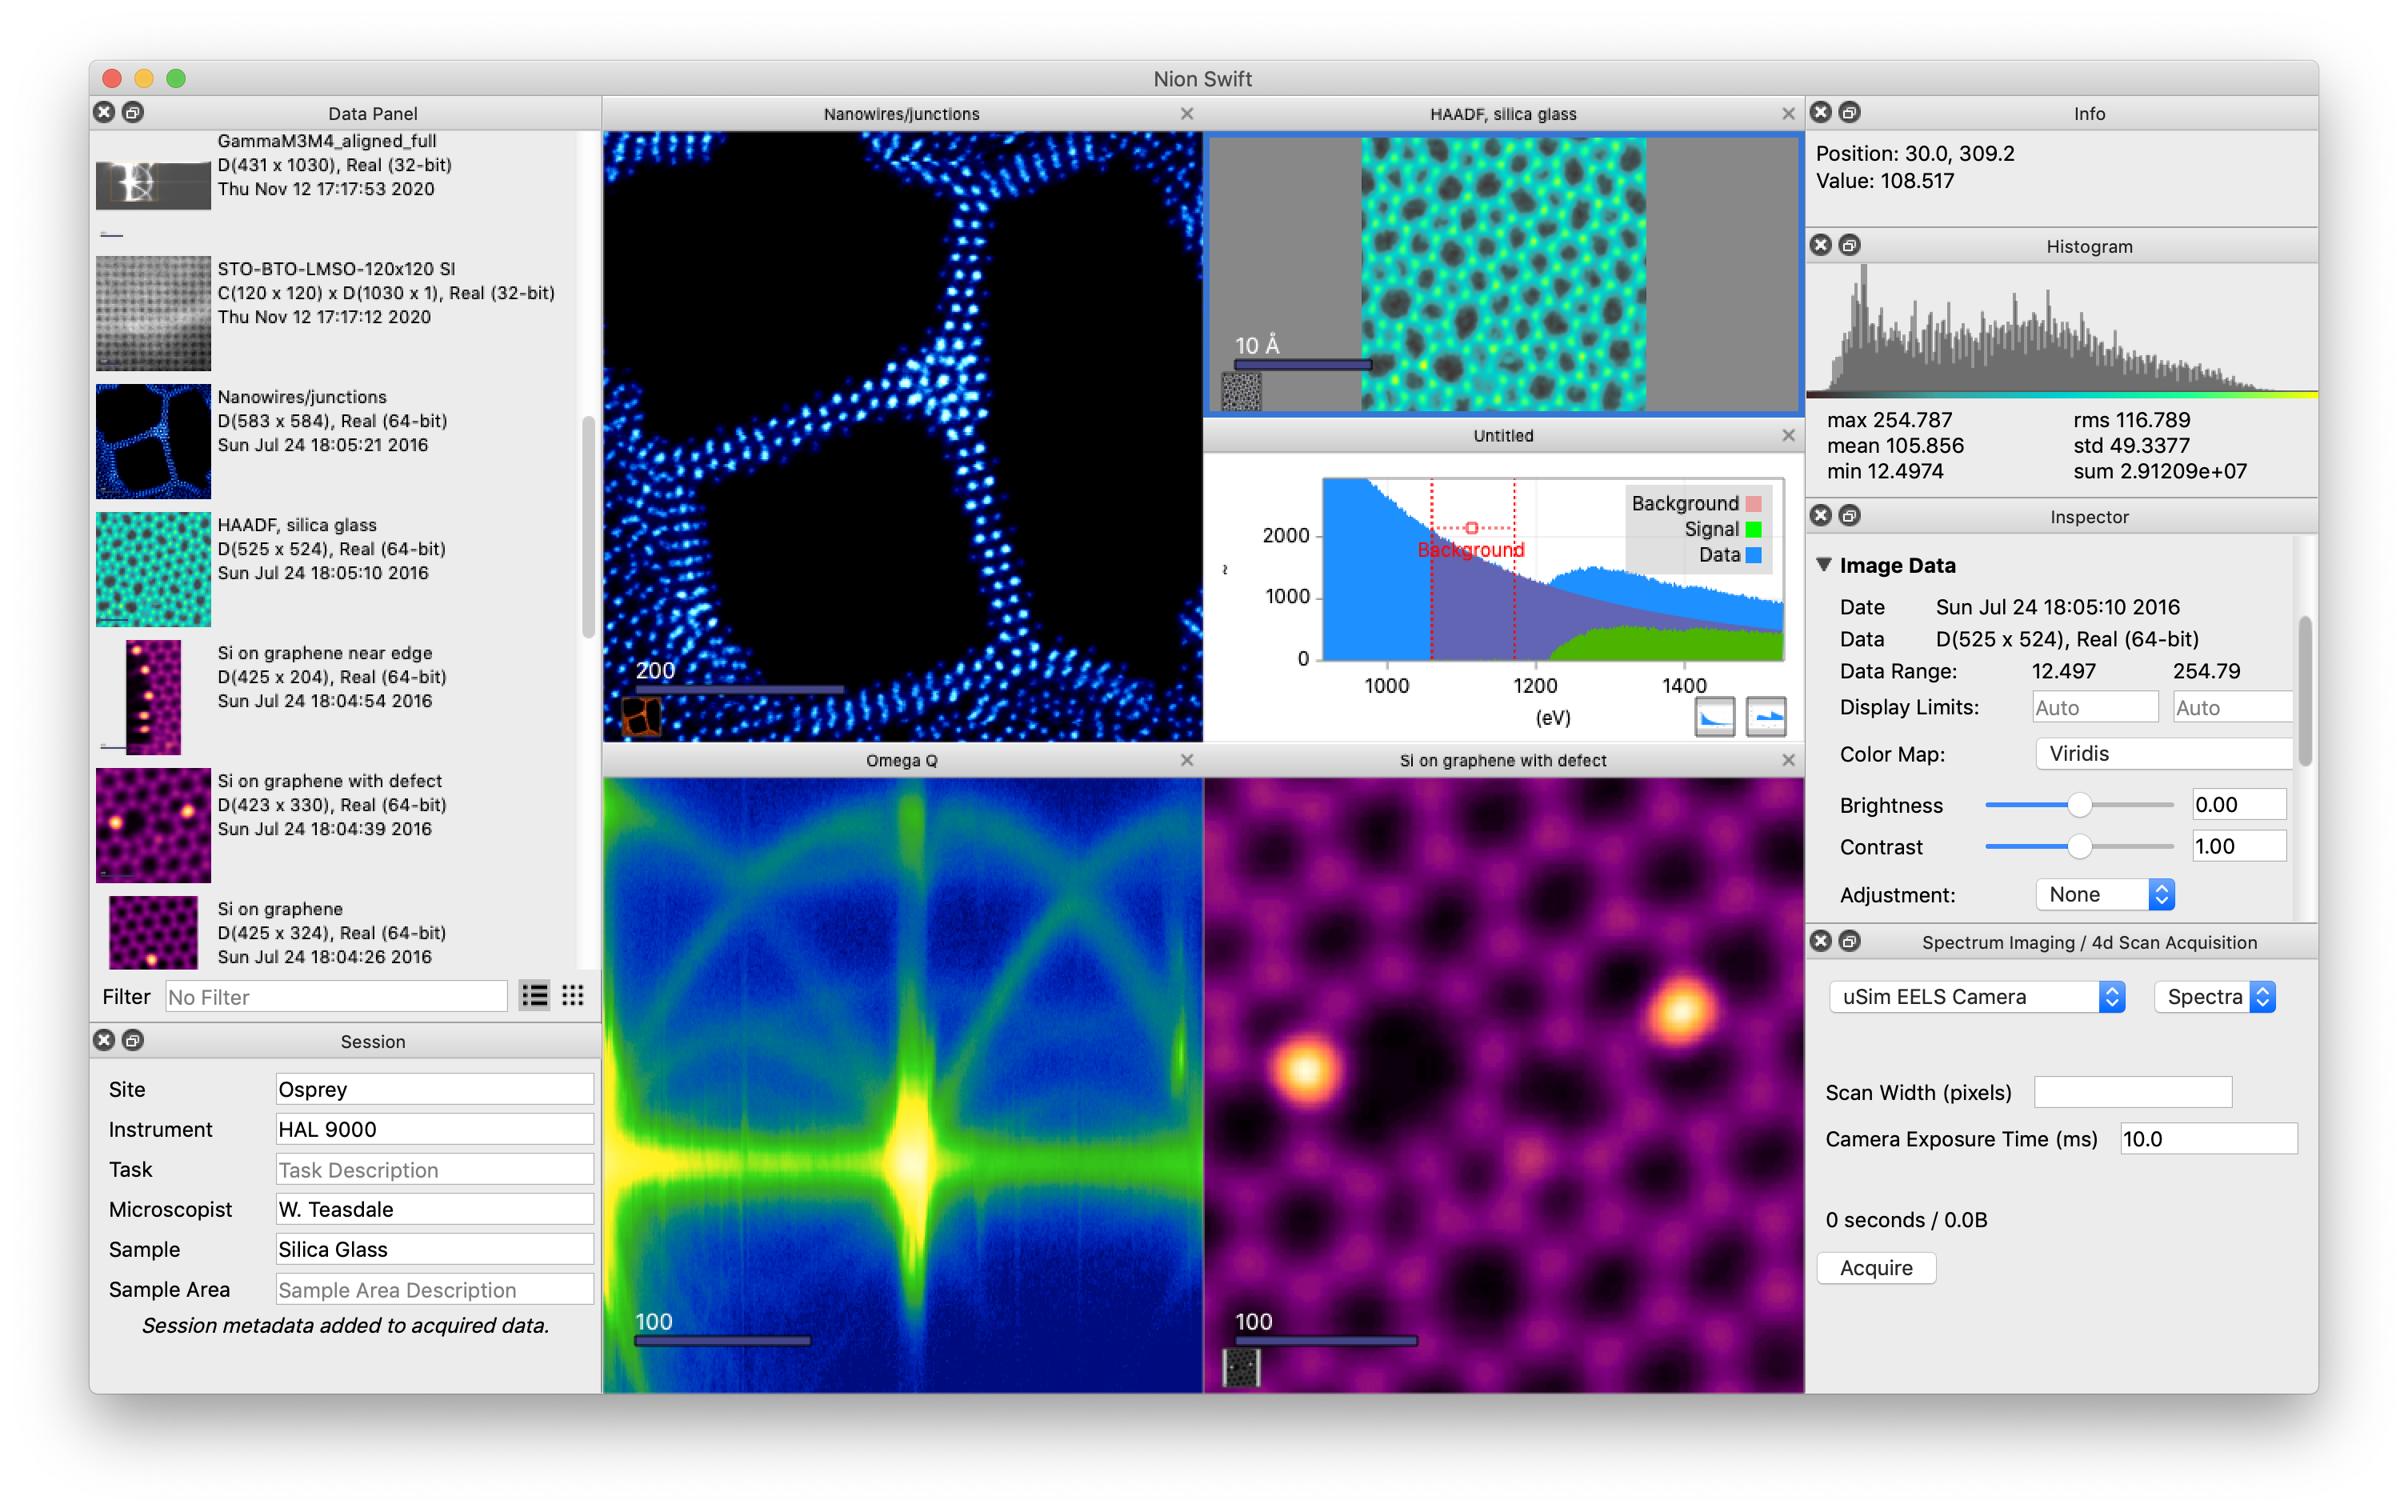
The user interface is comprised of two main sections: a central section called the workspace, and the surrounding area for utility panels.
Workspace
The central workspace is organized into display panels which can either display a single data item or thumbnail images of multiple data items in one of the browser formats. For more information, see Display Panels.
Utility Panels
The utility panels surrounding the central workspace allow you to make adjustments to a selected data item in a display panel. For more information on their specific functions, see Utility Panels.
Data Items and Display Items
Nion Swift primarily operates on data arrays such as 2D images and 1D spectra, which are generally called Data Items.
Data is stored in a project as data items. Data items can be dragged into display panels to be displayed. Data items that are displayed in a display panel can be annotated with graphics, processed with computations, and more. These displayed data items are referred to as display items.
See Data and Displays.
Graphics and Masks
Graphics are used to highlight portions of the data, select areas for processing, focus on specific sections of data, or otherwise annotate the data.
Masking allows you to block out part of an image and manipulate only a specific section of the data. You can use a preset mask or add graphics to a mask to precisely define your area of interest.
See Graphics.
Processing and Analysis
Nion Swift can perform processing and analysis on data by running computations, running Python scripts, filtering data, and more.
See Processing and Analysis for more information.
Projects
Nion Swift organizes data and other items into projects that are stored on your computer, similar to a folder. The project tracks relationships between items in the project.
All data items are stored in a project. Only one project can be open at a time.
You can add data to projects by importing data files or using Nion Swift to acquire data from acquisition devices.
See Data Management.