Graphics
Graphics mark and annotate regions in displays. They serve two roles: functional, where they designate a region for processing (such as a crop or line profile); and annotation, where they visually mark data for reference. Some graphics work with images, others with line plots.
Fourier graphics define filter regions that are applied when filtering Fourier data.
Graphics can be labeled using the inspector; the label appears next to the graphic on screen.
Most graphics can be added from menus or the Tool Bar (see Tool Bar).
To select a graphic, click on it.
To deselect all graphics, click outside them.
To edit selected graphics, select one or more graphics on the same display item and use the Graphics subsection of the Inspector panel.
Selecting a display panel with graphics shows parameters for all applied graphics in the Inspector panel.
Some graphics support position, shape, and rotation locks in the Inspector panel. When a lock is enabled, dragging that part has no effect.
To copy graphics, select them with Ctrl + click (or Command + click on macOS), then use Ctrl+C (or Command+C on macOS).
To cut graphics, select them and use Ctrl+X (or Command+X on macOS).
To paste graphics, use Ctrl+V (or Command+V on macOS).
To delete graphics, select them and press Delete or use .
To select a graphic behind another, click its control points directly — control points take priority over the body of graphics in front.
To cycle through graphics on a display in the order they were added, press Tab.
To cycle through graphics in reverse order, press Shift + Tab.
Image Graphics
Image graphics can only be placed on 2D image displays. Add one using the graphic buttons in the Tool Bar or the menu.
Line Graphic
The line graphic draws a line between two anchor points.
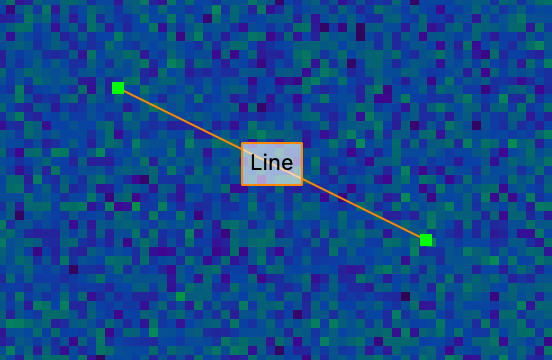
To move the line, click and drag anywhere along it (not on an anchor point).
To adjust an endpoint, drag an anchor point.
To resize symmetrically about the line midpoint, hold Alt (or Option on macOS) while dragging an anchor point.
To snap to multiples of 45°, hold Shift while dragging an anchor point.
In the Inspector panel, you can adjust the length, angle, and (x,y) coordinates of both anchor points.
Ellipse Graphic
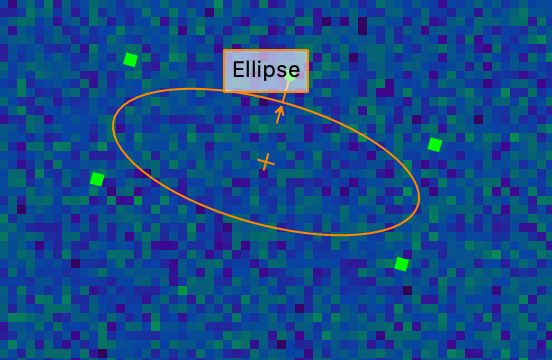
The ellipse graphic draws an ellipse defined by four anchor points.
To resize the ellipse about its center, drag an anchor point.
To resize with the opposite corner fixed, hold Alt (or Option on macOS) while dragging an anchor point.
To constrain the ellipse to a circle, hold Shift while dragging an anchor point.
To rotate the ellipse, drag the fifth, exterior anchor point.
To snap to 45° intervals when rotating, hold Shift.
To move the ellipse, click and drag from inside it.
In the Inspector panel, you can adjust the center point, height, width, and rotation.
Rectangle Graphic
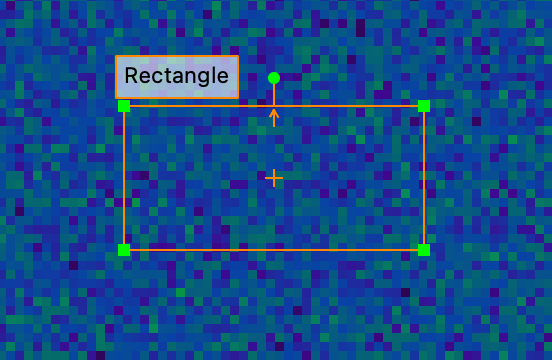
The rectangle graphic draws a rectangle with anchor points at the vertices.
To resize the rectangle with the opposite corner fixed, drag a corner.
To resize about the rectangle center, hold Alt (or Option on macOS) while dragging a corner.
To constrain the rectangle to a square, hold Shift while dragging a corner.
To rotate the rectangle, drag the fifth, exterior anchor point.
To snap to 45° intervals when rotating, hold Shift.
To move the rectangle, click and drag from inside it.
In the Inspector panel, you can adjust the center point, height, width, and rotation.
Point Graphic
The point graphic marks a single position with four surrounding anchor points.
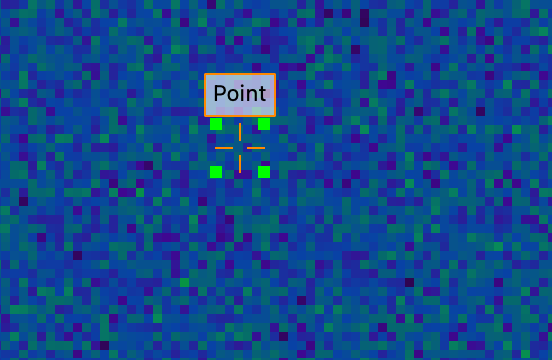
The anchor points indicate the graphic boundary and cannot be moved independently. Click and drag from inside the anchor points to move the graphic.
In the Inspector panel, you can adjust the (x,y) position.
Line Plot Graphics
Line plot graphics can only be placed on 1D line plot displays. Add one using the graphic buttons in the Tool Bar or the menu.
Interval Graphic
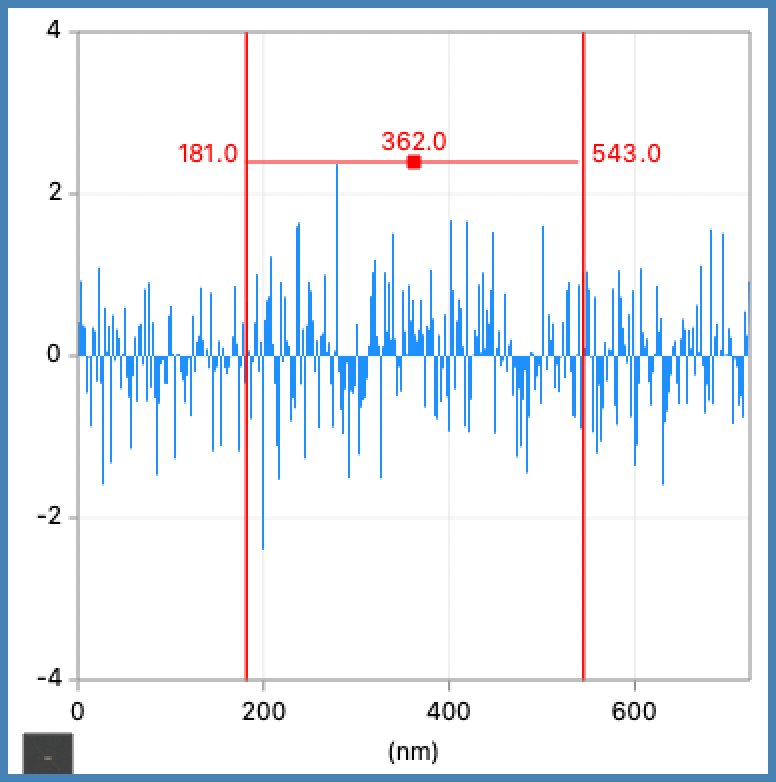
The interval graphic marks a range between two boundary positions on a line plot.
To adjust a boundary, drag it.
To move the entire interval, drag the center anchor point.
In the Inspector panel, you can adjust the channel values of each boundary.
If another interval graphic blocks creation of a new one, use the Interval Graphic button in the Tool Bar to force a new graphic. This can happen when selection resolves to an existing interval instead of creating another overlapping one.
When selected, the interval shows its left channel, right channel, and width values.
To move the interval by dragging a boundary instead of editing that boundary, hold Ctrl (Windows) or Command (macOS) while dragging.
Channel Graphic
The channel graphic marks a single position along the x axis with an orange marker.
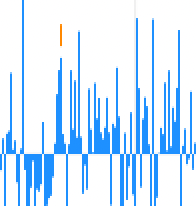
To reposition the marker, drag the orange marker.
In the Inspector panel, you can adjust the channel position.
Processing Graphics
Processing graphics are linked to a computation and automatically produce an output data item — editing the graphic updates the result in real time.
Line Profile
The line profile graphic defines a line used to sample data along its length, producing a new 1D data item from the image beneath the line.
Add a line profile using the Line Profile tool in the Tool Bar, or from the menu .
In the Inspector panel, you can edit the start, end, length, angle, and width.
To adjust an endpoint, drag it.
To resize symmetrically about the line midpoint, hold Alt (or Option on macOS) while dragging an endpoint.
To constrain adjustments to horizontal, vertical, or 45°, hold Shift while dragging.
To reposition the line, drag the middle of it.
To constrain movement to horizontal or vertical, hold Shift while dragging.
Press + or = to increase the line width, or - to decrease it.
See Line Profiles.
Using a Rectangle or an Interval as a Crop
A rectangle graphic on an image or an interval graphic on a line plot can be used as a crop to define a region of interest for processing.
To add a computation with a crop, select the graphic and choose the desired computation from the menu. The computation uses the selected graphic as a crop region.
Using Graphics as Masks
Graphics that cover an area on images or an interval on line plots can be used as masks to define a region of interest for processing.
Masks apply to any data, including non-Fourier data.
Masks are per display item, because graphics are attached to individual displays.
To use a graphic as a mask, select it and choose . The graphic turns blue to indicate that it is part of the active mask region.
To remove a graphic from the mask, select it and choose .
Fourier Filtering Graphics
Fourier filtering graphics define filter regions on complex-valued image data. They let you isolate and process a specific region of Fourier space — for example, to remove or preserve particular frequencies or angles — rather than operating on the full image. Add them using the graphic tools in the Tool Bar or the menu.
Because Fourier-space data is symmetric around an origin defined by the data calibration, Fourier filtering graphics are symmetric around that origin and provide intuitive control of frequency and angle regions.
For Fourier-space images, the origin is at the center of the image.
Diffractograms, which are captured from real-world cameras rather than computed, are not marked as Fourier-space internally and may have an off-center origin. Adjust the calibrations to set the origin for filtering.
Fourier filtering graphics are also used by and .
To add a regular image graphic to the active filter region, select it and choose .
To remove a regular image graphic from the active filter region, select it and choose .
A graphic turns blue when it is part of the active filter region.
Apply Fourier filtering using .
A pixel is considered within the filter region if its center falls within any Fourier filtering graphic.
Multiple Fourier filtering graphics combine as a union of their selected regions.
Four preset Fourier filtering graphics are available: Spot Graphic, Angular Graphic, Band-Pass Graphic, and Lattice Graphic.
For more information about adjusting parameters, see the Graphics subsection of the Inspector panel.
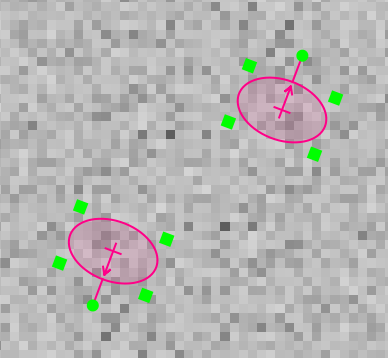
Lattice Graphic
The lattice graphic defines a repeating grid of circles across the image for filtering regularly spaced frequencies in Fourier space.
Two movable circles (shown with green anchor points) define the grid pattern, one inside the image and one outside.
If one circle is outside the visible image area, press - to zoom out to see both.
Band-Pass Graphic
The band-pass graphic creates a ring-shaped filter region centered on the Fourier origin.
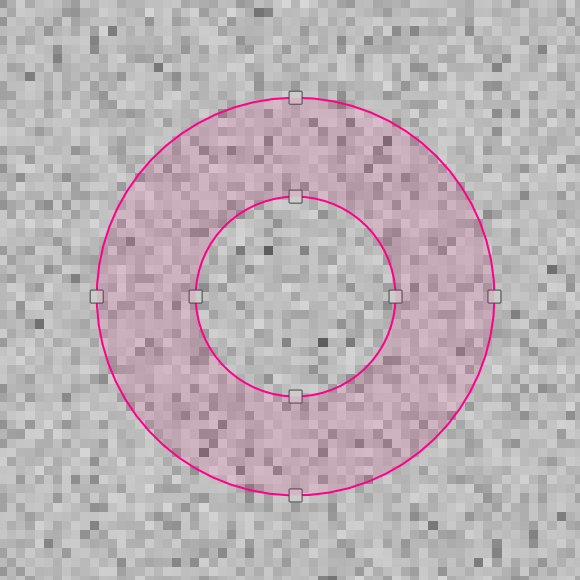
The ring can include the area inside the ring (low-pass), exclude it (high-pass), or select just a band between two radii (band-pass).
To adjust the radii, drag the anchor points along the image edges.
In the Inspector panel, you can adjust both radii and the filter mode. Radius 1 is the outermost radius. Low-pass excludes frequencies outside the ring; high-pass includes only those outside; band-pass selects the region between the two radii.
Spot Graphic
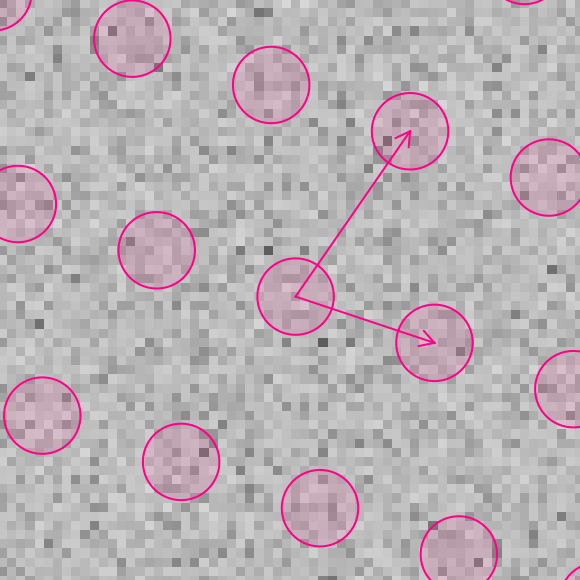
The spot graphic creates a pair of identical, symmetrically placed ellipses for filtering a specific frequency at a specific angle.
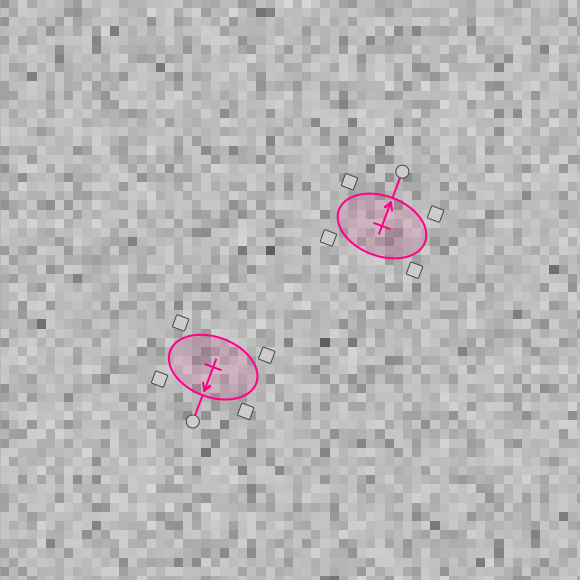
The two ellipses are always identical and placed symmetrically around the Fourier origin.
Manipulating one ellipse automatically updates the other.
If one ellipse is outside the visible image area, press - to zoom out.
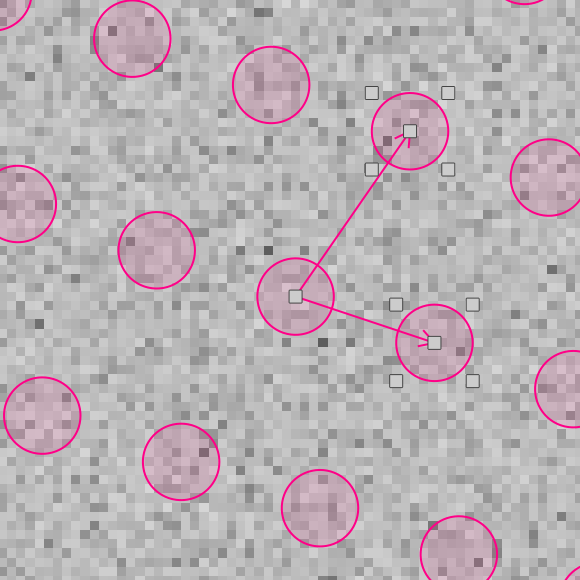
The ellipses behave like a regular Ellipse Graphic.
In the Inspector panel, you can adjust the center position and rotation of the ellipse inside the image.
Angular Graphic
The angular graphic defines a wedge-shaped filter region radiating from the Fourier origin, for filtering a range of frequencies at a specific angle.
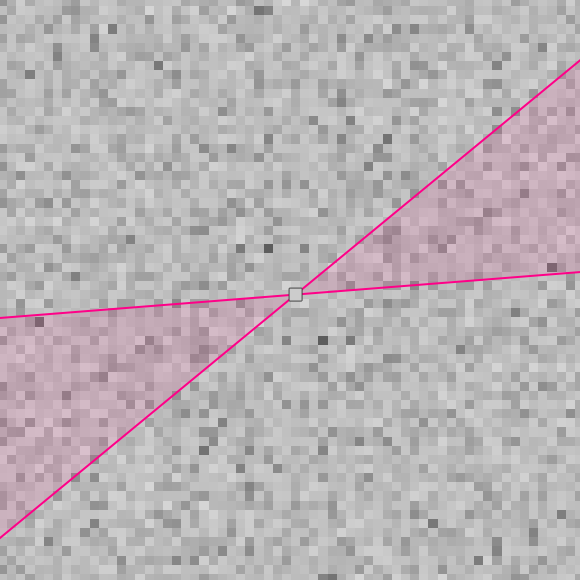
To move the wedge, click and drag within the highlighted region.
To adjust the angle range, drag either boundary line.
In the Inspector panel, you can adjust the starting and ending angles.